In this blog post, we will see how much better a machine learning model we can create by having more breakdowns available for training. Thus, we have split the dataset in to 7, 30, and 100 breakdowns and will see how much better a model gets, when having a larger representation of the wear and tear degradation.

Jet Engine
Being able to monitor the degradation of an Aircraft Engine for NASA, or any other company within the aerospace segment, can be extremely important.
The dataset is simulated for commercial aircrafts, thus, if an unplanned downtime occurs, this means a commercial airplane is in the air with customers. Being able to monitor the health condition of the aircraft engines is therefore of unmeasurable business value and ultimately saves human lifes.
Additionally, an A-10 Thunderbolt II from General Electric has a sales price of $1.95 million. Thus, besides being able to save lives, there is an economic benefit, if NASA can estimate the Remaining Useful Life of the engines and plan the maintenance such that they get closer to the optimum maintenance point. However, it is important to note that in this example the optimum maintenance point would have to be before take-off.
Introduction to the dataset
For this test, we will use NASA’s dataset on a Turbofan Engine. The dataset is simulated by the help of C-MAPPS, and only uses pre-installed sensors from the turbofan such as temperature and pressure.
Thus, the dataset does not have any of the sensors that neurospace recommend for detecting early signs of a change in the item’s health state. Additionally, data has been simulated with a sample frequency of 1 Hz, which is extremely low.
Thus, the longest life-cycle in this entire dataset is 362 cycles. It is expected a better model would be possible to create, if the data was retrieved in a larger sample frequency and sample interval.
For this test, we will split the dataset to:
- Only having 7 breakdowns when training a model
- Only having 30 breakdowns when training a model
- Having 100 breakdowns when training a model
We will use the last 25 breakdowns in the training dataset as the final test data, and to verify how much better the models get, with more breakdowns available for generating the model. The last 25 breakdowns available in the training dataset are not used for any of the models we make above, and are therefore perfect for the final test, as it will appear as “new data”.
7 Breakdowns
When having a model with 7 breakdowns available, we use the first 4 breakdowns for training, 1 breakdown for validation, and the last two breakdowns for testing.
The table below shows the result for this dataset:
| Train | Validation | Testing | Last 25 breakdowns | |
|---|---|---|---|---|
| Mean squared error | 0.0530 | 0.0268 | 0.0764 | 0.1264 |
Train true vs predicted
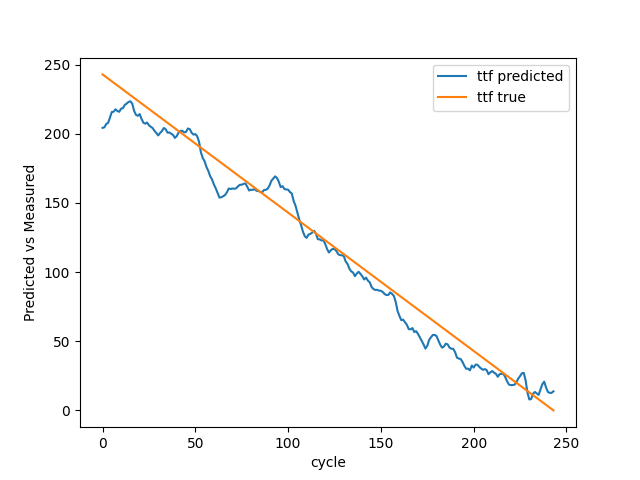
Validation true vs predicted
We have a model that is rightfully getting the trend in both train and validation, but fails to predict the initial breakdown. However, in this case with NASA, it is more important to get the trend than the initial breakdown.
30 Breakdowns
When having a model with 30 breakdowns, we use the first 20 breakdowns for training, 4 breakdowns for validation, and the last 6 breakdowns for testing.
The table below shows the result for this dataset:
| Train | Validation | Testing | Last 25 breakdowns | |
|---|---|---|---|---|
| Mean squared error | 0.0533 | 0.0699 | 0.0771 | 0.1030 |
Train true vs predicted
Validation true vs predicted
Even though you can see that the mean squared error for train, validation and test loss are impaired compared to the first model, this model does have more breakdowns, and therefore, you cannot compare them 1:1. However, if we look at the last 25 breakdowns we use for the final test, the model has reduced its mean squared error from 0.1264 to 0.1030.
100 Breakdowns
When having a model with 100 breakdowns, we use the first 75 breakdowns for training, 10 breakdowns for validation, and the last 15 breakdowns for testing.
The table below shows the result for this dataset:
| Train | Validation | Testing | Last 25 breakdowns | |
|---|---|---|---|---|
| Mean squared error | 0.0553 | 0.0581 | 0.1106 | 0.0823 |
Train true vs predicted
Validation true vs predicted
Again, the mean squared error for train, validation and test are impaired compared to the first model, however, if looking at the final test, our model improves from 0.1264 to 0.0823 by having 100 breakdowns, instead of 7. Additionally, our model successfully predicts the trend and also the breakdowns in the validation data.
Conclusion
The last 25 breakdowns available in the training dataset are used to being able to compare the three models created. We use the first model with only 7 breakdowns available as a reference value (index 1.0000). When going from having 7 breakdowns available to create a machine learning model to having 30 breakdowns, we reduce the model’s mean squared error with 18.51%. Additionally, going from having 7 breakdowns to 100 breakdowns available, reduces the model’s mean squared error with 34.89% (See the table below).
| Test 25 breakdowns Mean Squared Error | Index | |
|---|---|---|
| 7 Breakdowns | 0.1264 | 1.0000 |
| 30 Breakdowns | 0.1030 | 0.8149 |
| 100 Breakdowns | 0.0823 | 0.6511 |
As mentioned previously, a better model performance for predicitve maintenance could help NASA in saving lifes and money as each of their A-10 Thunderbolt II engines has a sales price of $1.95 million. But what is the cost of this improvement? NASA was lucky to be able to simulate the data, and it is exiting to see, if we can do the same with Digital Twins. However, if a company cannot simulate accurate breakdowns, this improvement of model performance, comes with very high costs, and extremely long implementation time before value can be generated.
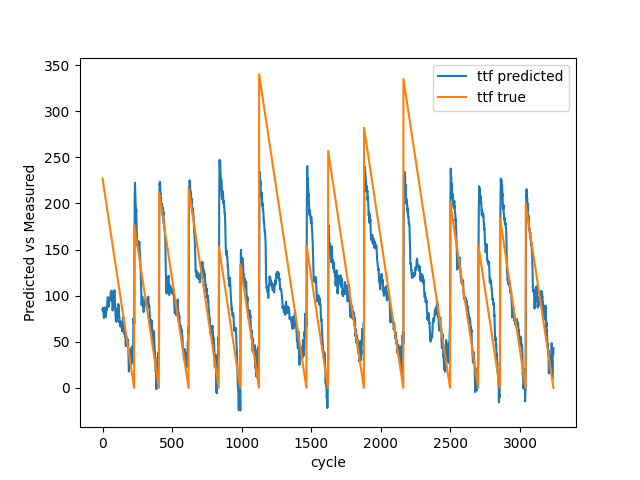
The images below shows the result for the test data with 7, 30, and 100 breakdowns. As you can see, going from 7 to 100 breakdowns, our model gets better at predicting the early stages of the Remaining Useful Life. It additionally gets better at estimating the breakdowns.
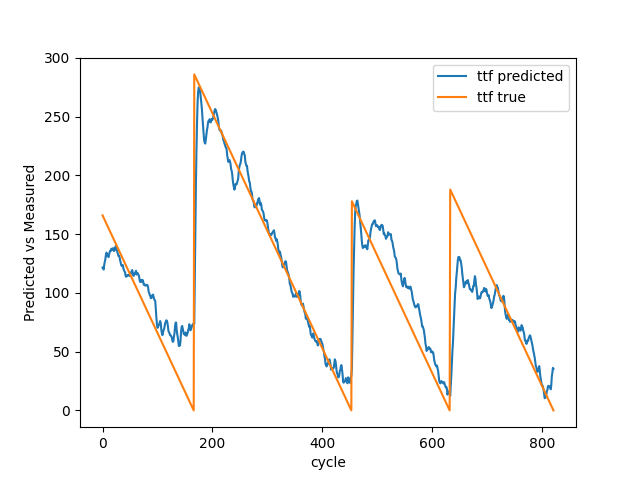
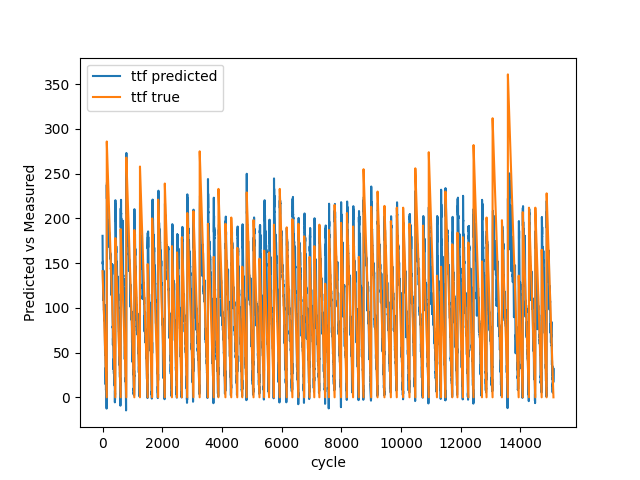
Test result with 7 breakdowns
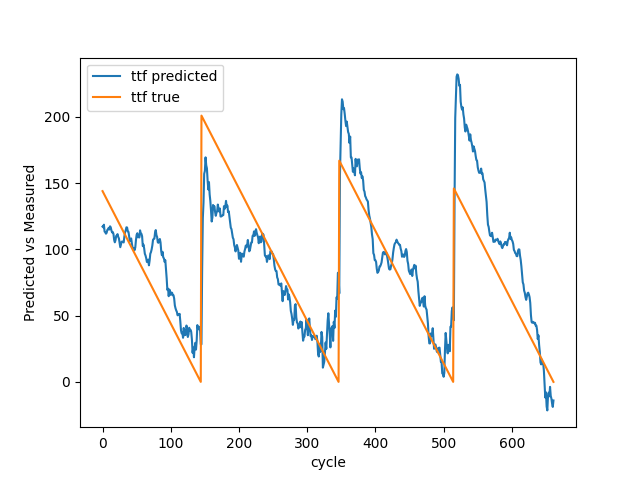
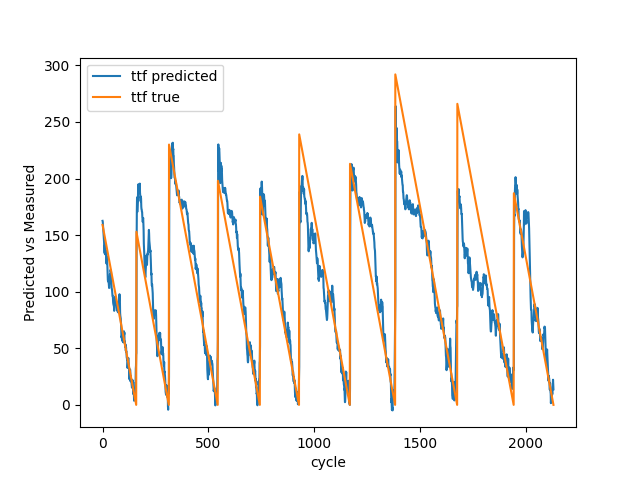
Test result with 30 breakdowns
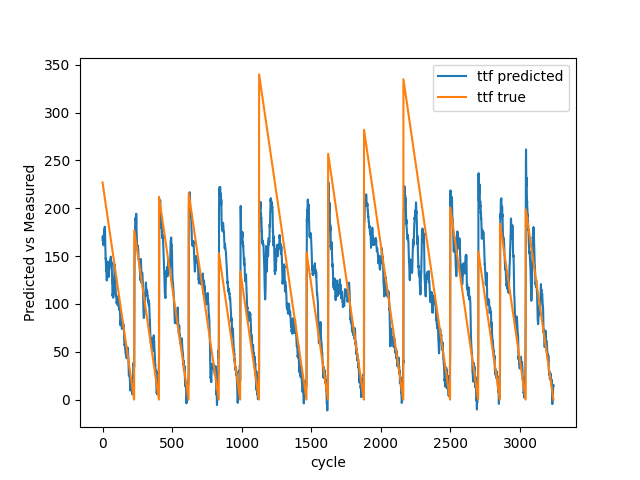
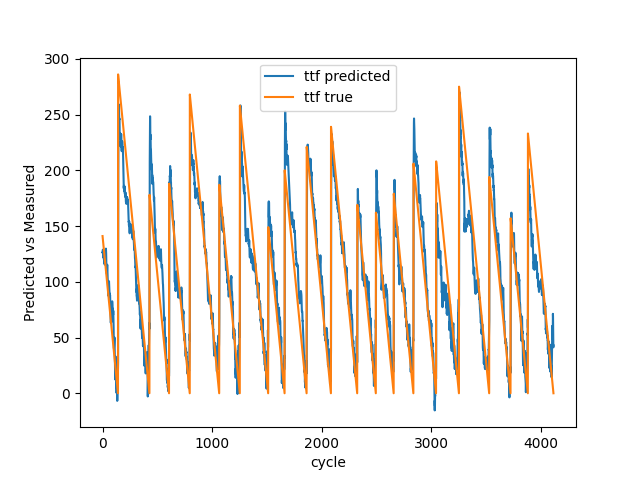
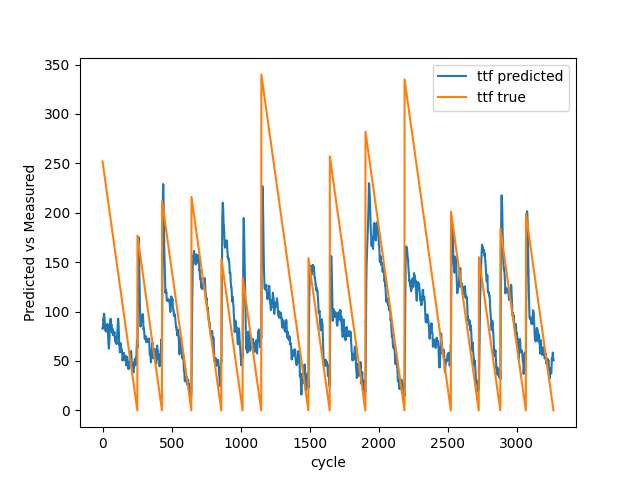
Test result with 100 breakdowns
The dataset used in this case, comes with an extremely low sample frequency. Even though the dataset from the water pump, previously used for Remaining Useful Life predictions had a low sample frequency, this was higher than the one we see in the NASA dataset.
Having vibration and ultrasound data retrieved from the aircraft engines, in a higher sample frequency, would improve these predictions significantly. We have proven time and again that having the right data in the right frequency, is more important than having large representation of an incident with data from less relevant sensors and with a too low sample frequency.
If you retrieve the right data in the right sample frequency and in the right sample interval, you will be able to get a very good model for estimating the Remaining Useful Life, by just having 7 breakdowns available.
// Maria Hvid, Machine Learning Engineer @ neurospace